
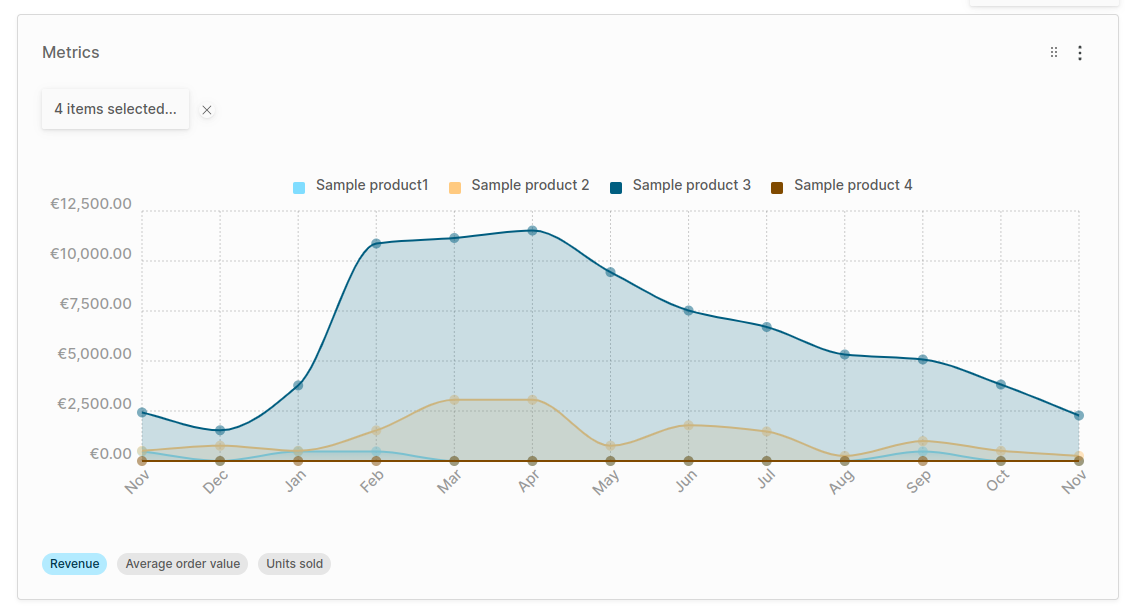
Metrics
Visualize your shop's average order value, orders per month and more customizable graphs
Latest version3.1.0
Compatibility>=2.2.0
Last publishedFeb 5, 2026

PinelabWebshops for mission-driven brands and wholesalers
A plugin to visualize your shops most important metrics.
Getting started
- Configure the plugin in
vendure-config.ts:
- Rebuild your Admin UI
- Run a database migration to add the necessary tables to your database.
- Start your Vendure server and login as administrator
- You should now be able to add the widget
Advanced Metricsto your dashboard.
Metric results are cached in memory to prevent heavy database queries every time a user opens its dashboard.
Built-in Metrics
- Revenue (per product): The total revenue per month, or the revenue generated by specific variants if a variant is selected.
- Average Order Value (AOV): The average of
order.totalWithTaxof the orders per month - Units sold: The number of units sold for the selected variant(s).
You can implement the MetricStrategy interface and pass it to the MetricsPlugin.init() function to have your custom metric visible in the Widget.
Below is the implementation of the AOV metric, already included in the plugin, but it serves as an example of how to implement a custom metric.
Contributions
Special thanks to@dalyathan for his contributions on this plugin.